
Introduction
Oilfield operations run on thin margins. Every delay, equipment failure, or inefficiency comes with a heavy price tag.
Not only in dollars, but also in unnecessary emissions.
When I joined Nextier Oilfield as a Senior Data Scientist, I set out to answer one question:
Can AI make drilling smarter, cleaner, and more efficient?
Over two years, I built predictive models, scaled data pipelines, and even tested deep reinforcement learning approaches. The results: over 5% cost savings, measurable emissions reductions, and a cultural shift toward embedding AI directly into field operations.
The Challenge
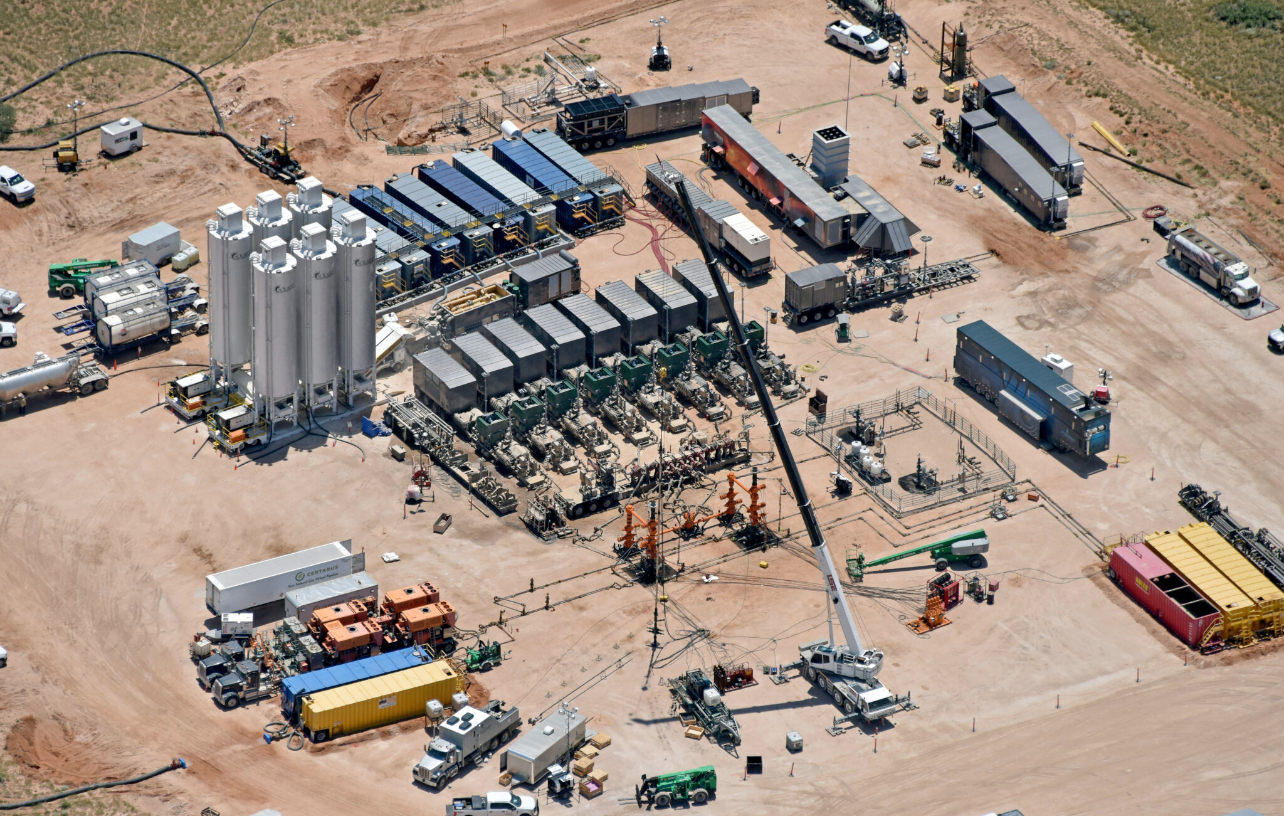
Fracking fleets are complex, high-stakes systems. At any given site, ~30 pumps work in tandem to maintain the high pressures required for drilling oil and gas wells. These pumps run continuously in four-hour shifts, with only brief 30-minute rest periods in between. The operational goal is to keep well pressure stable and achieve an optimum flow rate, a balance that ensures both efficiency and safety.
To achieve this, operators must constantly modulate key engine and sensor parameters — adjusting gear settings, RPM, and hydraulic horsepower (HHP) — so that the fleet runs as close to its “sweet spot” as possible. The fracking pumps and engines push the system to its limits, while transient power surges add further stress. All of this unfolds in an environment where equipment is worth millions of dollars and downtime can cost thousands per hour.
Traditional monitoring tools were largely reactive, alerting teams only after failures or inefficiencies had already occurred. What was needed was a system that could predict problems before they happened and guide operators toward consistent, optimized performance across the entire fleet.
Scaling the Data Foundation
The first step was building a Machine Learning (ML) infrastructure. There were hundreds of sensors on the fracking fleets which generated millisecond-resolution time series data, streamed directly into Google Cloud from the field. This data was massive, raw and unstructured, and required a dedicated cleaning and preprocessing pipeline before it could be used effectively.
Not all fleets were the same, they operated in different geologic regions, with varying pump characteristics, transmission types, and engine configurations. To maintain data genealogy and provenance, every data point had to be sorted, tagged, and aligned with its corresponding equipment setup before it could be compared or modeled.
I designed a scalable ingestion system on Google Cloud Platform, leveraging BigQuery to handle terabytes of time series data with both speed and reliability.
This foundation enabled:
- Real-time analytics instead of static after-the-fact reports
- Seamless scaling as data volume and sensor coverage expanded
- A robust platform for machine learning models that could run continuously and deliver actionable insights
Without scalable infrastructure, predictive modeling is just theory. With it, AI becomes actionable.
From Asset Categories to Efficiency Metrics
Before building predictive models, we first had to establish clear asset categories. Each fracking fleet included dozens of pumps, but not all were the same — they differed by engine type, transmission setup, and operational region. To make the data meaningful, we grouped pumps into comparable asset categories and monitored them on a like-for-like basis. This ensured that insights were tied to the right equipment setup, rather than blending fundamentally different machines.
Once the asset categories were defined, we developed efficiency metrics centered on the three key parameters of pump performance: hydraulic horsepower (HHP), RPM, and gear ratio. These metrics allowed us to track how close a pump was operating to its optimal state, and to design time series models that predicted deviations before efficiency was lost.
The chart below illustrates this approach. It’s a Pareto chart of transmission HHP for one specific asset category.
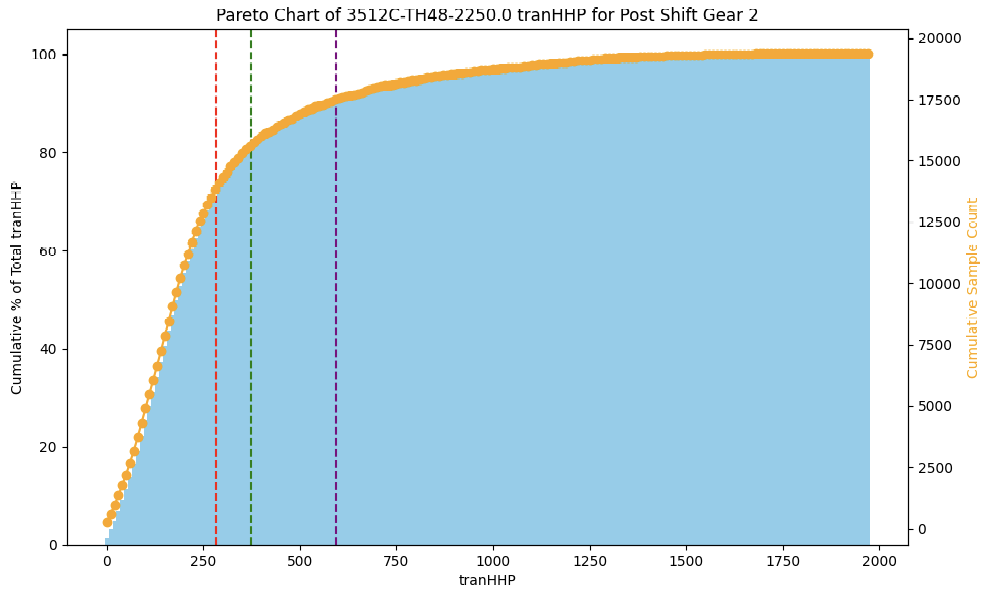
On the x-axis we have transmission HHP, while the y-axis shows the cumulative percentage contribution of that HHP to overall performance. The orange line represents the cumulative sample count.
What this shows is that most of the pump’s effective work is concentrated in a narrow operational band of HHP values. By identifying this “sweet spot,” we could then build forecasting models to ensure the pumps stayed in that efficient range. This is what optimization meant in practice: not pushing machines to their theoretical maximum, but keeping them consistently at their most reliable and efficient operating levels.
Predictive Models in Action
Once the data pipeline was stable and we had structured the sensor streams into asset categories, we could begin building models that made the data truly actionable. One of the first priorities was to forecast pressure levels across pumping stages. With ~30 pumps working together to maintain well pressure and flow, even small deviations could ripple across the system and threaten stability. Our models helped anticipate those deviations, giving operators a forward-looking view instead of reacting once problems had already occurred.
We also developed predictive maintenance models to monitor equipment health in real time. By learning from vibration, temperature, and performance signals, these models could spot patterns that indicated a pump was trending toward failure. Instead of waiting for a costly breakdown that could stall an entire fleet, operators were alerted early enough to schedule maintenance proactively — turning unplanned downtime into planned service windows.
A third focus area was managing transient power demands. Pumps often faced sudden spikes in load as conditions in the well changed, leading to energy surges that strained engines, wasted fuel, and drove up emissions. By forecasting these transients, we gave operators a way to smooth out energy use while keeping flow rates steady.
The results were immediate and measurable. Fleets saw downtime reduced as teams shifted from reactive firefighting to proactive planning. Operational efficiency improved across the board, producing more than 5% in cost savings. And by keeping pumps closer to their optimum efficiency, fuel use dropped, directly contributing to lower emissions.
These predictive models weren’t abstract exercises — they directly changed how fleets were run, turning noisy sensor data into operational foresight and measurable business impact.
Experimenting with Deep Reinforcement Learning
Beyond prediction, we explored control optimization using Deep Reinforcement Learning (DRL).
We framed drilling as a control problem:
- Actions → Efficiency outcomes
- DRL agents tested strategies to balance pressure, flow, and energy use
- We learned DRL showed promise, but required careful handling of sparse, repetitive states in the data
This experimentation opened doors for broader applications — not just oilfields, but manufacturing, smart grids, and heavy industry.
Embedding AI into Operations
The real success wasn’t just in building models — it was in adoption.
By collaborating with engineers, operators, and business teams, we made AI an everyday decision-making tool, not just an analytics dashboard.
This shift amplified outcomes:
- Faster decisions
- Optimized processes
- Trust in data-driven operations
Final Thoughts
AI in energy isn’t about buzzwords. It’s about concrete results: efficiency gains, emissions reductions, and safer operations.
At Nextier, we proved that predictive modeling and scalable AI systems can transform even the most traditional industries. And while our work started in oilfields, the lessons are widely applicable, from industrial manufacturing to smart grids and renewable energy management.
The future of energy is data-driven, and I’m excited to keep building solutions that power that transition.


Follow Me