

Introduction: The 40-Billion-Tonne Problem
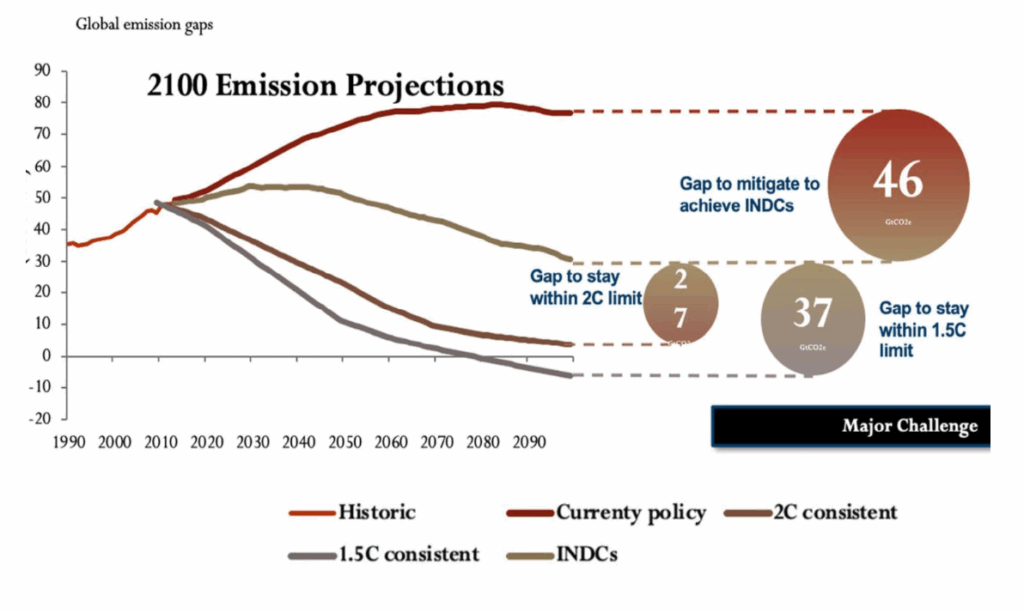
The world is emitting 40 billion tonnes of CO₂ every year. If we want to stay within the 1.5°C warming limit, that number needs to be cut in half by 2050.
On paper, it sounds straightforward. In reality, it’s a minefield of policy changes, market disruptions, and technological breakthroughs. This is the world of climate transition risk, where financial strategy collides with the race to decarbonize.
For investors, banks, and companies, the stakes are enormous. Transition too slowly, and the costs—from stranded assets to rising compliance penalties can spiral. Move too fast without a strategy, and profitability suffers.
In this case study, I explore how emissions pathways, carbon pricing, and abatement technologies interact and what that means for companies preparing for a low-carbon future.
What is Transition Risk?
Transition risk refers to the financial risks arising from the shift towards a low-carbon economy. As decarbonization becomes a strategic priority, companies face mounting regulatory, market, and reputational pressure to act. Investors and financial institutions, in turn, must evaluate corporate transition plans to protect their portfolios and align with climate commitments.
Why It Matters
Global emissions are currently around 40 GtCO₂ per year, but to stay within the 1.5°C limit, they must be cut in half by 2050. Without swift, strategic action, the gap between today’s trajectory and climate-safe targets will widen, driving up compliance costs, stranding assets, and triggering market disruptions.
Case Study Scope
I modeled 50 companies across 10 sectors and 9 regions, projecting multiple scenarios from 2025 to 2050.
My goal: Quantify the trade-offs between emissions cuts, carbon pricing, and abatement investments—and pinpoint which strategy becomes more financially effective than the others.

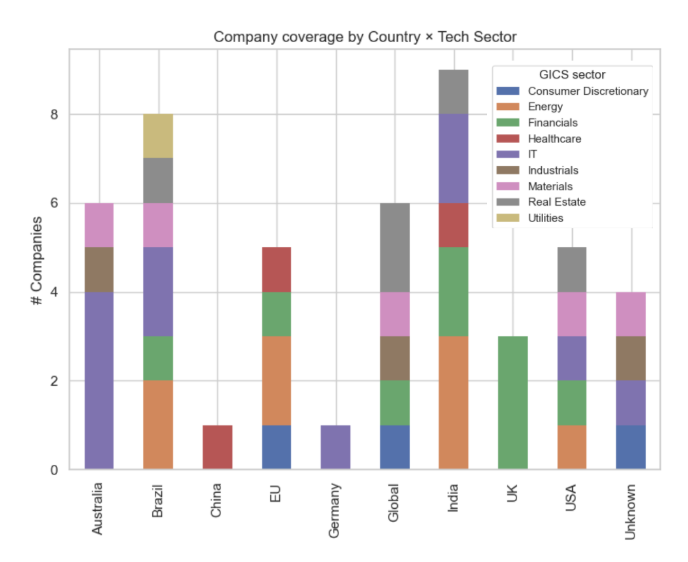
- Companies: 50
- Sectors: 10
- Regions/Countries: 9
- Time Horizon: 2025–2050
Methodology
My modeling approach integrated emissions data, carbon price projections, and abatement cost analysis.
1. Mapping the Pathways — Company-Level Emissions Projections
For this case study, I modeled emissions trajectories for each individual company in the dataset from 2025 through 2050.
The starting point for each projection was the company’s publicly stated emissions reduction target, which could be defined in two ways:
- Absolute targets — a fixed end-goal emissions value for 2050 (e.g., “reduce total CO₂ emissions to 10 Mt by 2050”)
- Intensity-based targets — a reduction in emissions relative to production output (e.g., “cut emissions per unit of production by 30% by 2050”)
Once I identified the target type, I modeled how they might get there:
1. Absolute Targets
For companies with absolute targets, I assumed a steady, linear decline from current emissions down to the 2050 goal. This creates a simple, predictable pathway where the year-on-year reduction rate is constant, making it easy to gauge whether a company is on track. In reality, emissions reductions don’t always follow a straight line. They can be front-loaded, with aggressive early cuts to take advantage of low-hanging efficiency gains, or back-loaded, where reductions accelerate closer to the target year due to technology breakthroughs or policy mandates. I chose the linear method here for clarity and comparability across companies, while recognizing that other pathways could yield very different short-term and long-term implications
2. Intensity-Based Targets
For companies with intensity-based targets, I needed to factor in potential changes in production over time. Even if the emissions per unit of output improve, total emissions can still rise if production grows significantly, for example, through acquisitions, market expansion, or increased demand. To illustrate: a company producing 100 units at 1 tonne of CO₂ per unit emits 100 tonnes; if it cuts intensity by 20% to 0.8 tonnes per unit but increases production by 50% to 150 units, its total emissions would climb to 120 tonnes. Since most companies do not publish detailed long-term production forecasts, I assumed production rates and modeled three growth scenarios: no growth, growth of 1% per year, and growth of 2% per year. This approach combines the projected efficiency improvements with potential production growth, providing a more realistic view of future total emissions.
3. Scope of Reductions
I quantified each company’s emissions pathway based on its stated target, whether it aimed to reduce Scope 1, Scope 2, or both. Scope 1 covers direct operational emissions, while Scope 2 accounts for indirect emissions from purchased energy. Scope 3, which includes value chain emissions, was only included if explicitly stated in the company’s data goals. Strategies vary: Scope 1 reductions often involve operational changes or fuel switching, Scope 2 focuses on renewable energy sourcing and efficiency, and Scope 3 requires supplier engagement or product redesign. These differences shape the abatement costs and technology options considered later in the carbon pricing analysis.


2. Carbon Pricing
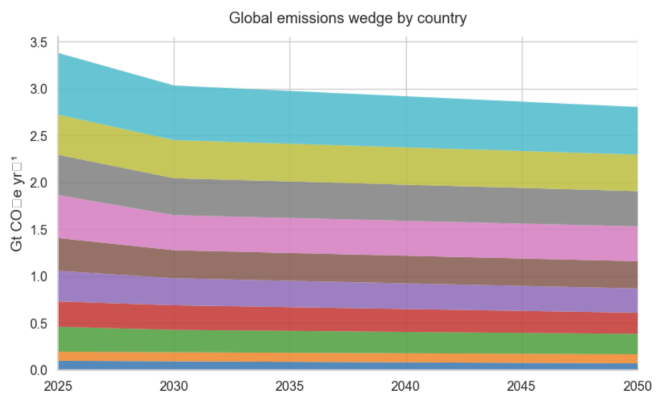
For carbon pricing, I modeled projections separately for each sector, region, and scenario, using historical data to capture existing price dynamics. I applied linear regression to the observed years, then extended those trends forward to 2050. The dataset included three predefined scenarios—low, medium, and high carbon price pathways—which reflect different policy ambitions and market conditions. Carbon pricing is inherently difficult to forecast, as it depends on a complex mix of factors including regulatory changes, market demand for allowances, economic cycles, and the pace of decarbonization. By breaking the analysis down to the sector–region–scenario level, the projections aimed to capture a realistic range of possible cost trajectories that companies might face over the coming decades.
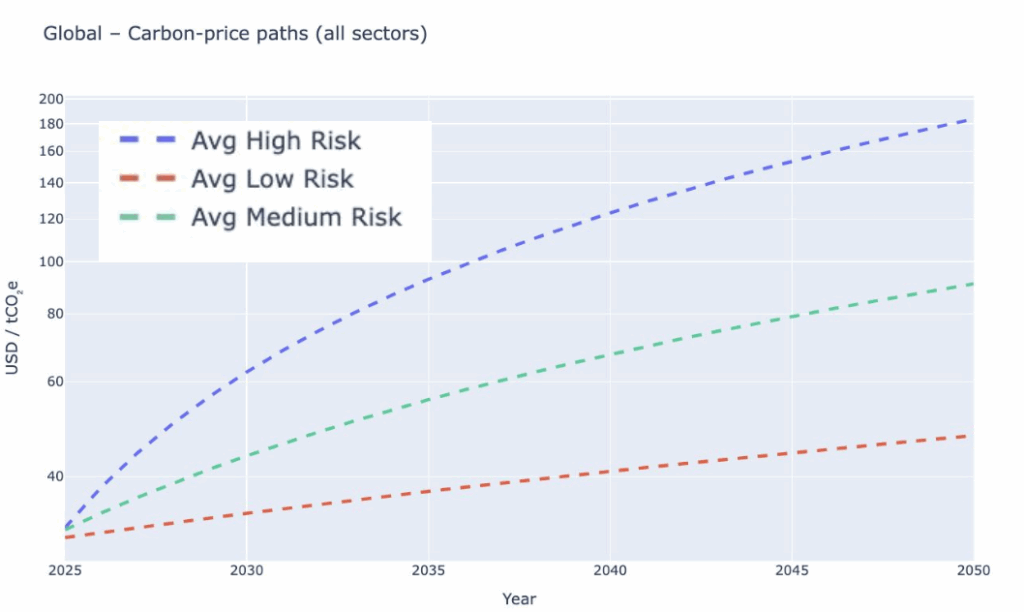

The global projections show a clear divergence between scenarios, with the high-price pathway exceeding USD 160/tCO₂e by 2050, while the low-price pathway remains below USD 60/tCO₂e. Regional breakdowns reveal significant variation: the EU consistently shows the steepest price increases, followed by the USA, while China and India remain comparatively lower-priced markets even in the high scenario. These differences underscore the importance of regional policy environments in shaping carbon cost exposure for companies.

The “Pay the Tax” analysis compares the total cost of carbon tax for companies meeting only their stated targets versus reaching full net-zero by 2050 under the low-risk carbon price scenario. In nearly every case, the cost of achieving net-zero (blue bars) is substantially higher than meeting the stated target (green bars), underscoring the financial gap between incremental commitments and complete decarbonization.
3. Abatement Cost Estimation
Abatement refers to the measures a company can take to reduce its greenhouse gas emissions, such as improving energy efficiency, switching to cleaner fuels, adopting low-carbon technologies, or capturing and storing CO₂. For this analysis, I wanted to determine whether, over a 25-year period, it would be cheaper for a company to invest in abatement technologies or to continue purchasing carbon allowances or paying carbon taxes. I began by filtering technologies by sector and region to ensure they were relevant to each company’s operations, then ranked them by their lowest levelized cost—calculated as the capital expenditure divided by annual capacity, plus the operating cost per tonne of CO₂ removed. This approach highlights the most cost-effective options available while accounting for differences in technology readiness and applicability. In some sectors, low-cost measures like efficiency upgrades or fuel switching dominate, while in others, higher-cost solutions such as carbon capture are more common. These cost estimates formed the foundation for the trade-off analysis comparing abatement investment with projected carbon pricing.

The cost of abatement technologies is highly variable and often depends on the maturity of the technology. More established options, such as energy efficiency upgrades or utility-scale solar, generally have lower and more predictable costs, while emerging technologies like hydrogen fuel or grid-scale battery storage are currently more expensive but could see significant cost reductions in the future as adoption increases and manufacturing scales up. This variability is critical when comparing present-day investment decisions with potential long-term benefits.
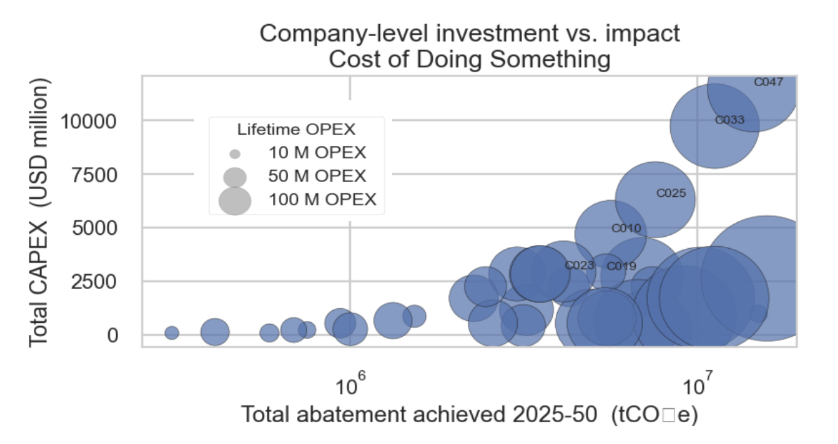
The chart shows the median cost of leading abatement technologies, with mature, lower-cost options clustered toward the bottom of the cost range, and newer, less established technologies appearing at the higher end. The second chart, Company-level investment vs. impact, plots the total capital expenditure against the total emissions abated for each company from 2025 to 2050, with bubble size representing lifetime operating expenditure. This visualization highlights how some companies can achieve significant abatement with relatively modest investment, while others require substantial capital outlay to reach comparable reductions. These cost curves form the basis for the trade-off analysis comparing abatement investments with projected carbon pricing.
Discussion
Which is cheaper Carbon tax or Abatement technology?
Picture this: a choice between slashing emissions with cutting-edge technology or simply writing a check for carbon credits. At first glance, it might seem like a no-brainer, pick the cheaper option. But the chart above reveals a deeper story, one far more complex than it appears. Each dot represents a company, with the x-axis showing the cost of investing in emissions-cutting tech through 2050, and the y-axis revealing their carbon tax or credit bill if they do nothing. The red dashed line? It’s the break-even point: below it, abatement saves money; above it, taxes win out.
Investing in abatement tech, however, is like buying your own home. The upfront cost is steep, but it delivers lasting rewards: slashed emissions, stable costs, and a robust stance in a carbon-savvy market. As tech like hydrogen and grid-scale batteries gets cheaper, more firms will dip below that break-even line. Over time, the financial edge of greener tech grows undeniable.Abatement shines long-term, locking in permanent emissions cuts and shielding against rising prices, tougher regulations, and reputational hits. Unlike credits, a recurring expense with no operational gain, abatement boosts efficiency, trims energy costs, and equips companies to meet bold climate goals without leaning on shaky markets. Still, success hinges on variables: future carbon prices, evolving tech costs, and shifting market trends. A surge in consumer demand or policy shifts could swiftly render old tech obsolete, tipping the scales toward sustainable solutions.

Key Takeways
The path to decarbonization is rarely a neat downward slope. Emissions don’t fall in straight lines—they drop in steps, often triggered by new regulations, breakthrough technologies, or a shift in corporate strategy.
Carbon prices are just as unpredictable. They move with economic cycles, political priorities, and market sentiment. Regional differences are stark—Asian markets generally price carbon lower than their Western counterparts, creating uneven incentives for change.
Abatement technologies tend to win over the long haul. While they require substantial upfront investment, rising carbon prices gradually tip the balance in their favor, making them more cost-effective than continually buying credits.
The trade-off isn’t one-size-fits-all. The tipping point where abatement outperforms credit purchases depends on the sector, the region, and the company’s operational profile.
Next Steps
My next goal is to explore a Composite Transition-Risk Score—a single, comparable metric that captures:
- Emissions performance
- Exposure to carbon price fluctuations
- Abatement cost efficiency
- Technology readiness
With this score, investors, regulators, and corporate leaders could benchmark transition readiness across industries and geographies.
Final Thoughts
Transition risk isn’t a distant concern,it’s shaping the competitive landscape today. Companies that act early, invest in cost-effective abatement, and anticipate carbon price dynamics will be better positioned to thrive in a low-carbon economy.


Follow Me