


A City at the Edge of the Water
New York City has always lived with water — it’s built on islands and waterfronts. But climate change, heavier rainfall, and urban expansion are making that relationship riskier.
Urban flooding is rapidly emerging as one of the most pressing climate threats, and in cities like New York — where dense infrastructure converges with rising seas and more intense rainfall — the risks are especially severe. This project combined predictive modeling, geospatial analysis, and urban vulnerability assessment to identify which neighborhoods are most at risk — and how evacuation planning could be made more effective. I set out to answer a critical question: Which neighborhoods are most vulnerable to flooding, and how can we plan better evacuations before the water rises?
Drawing inspiration from studies such as Eini et al. (2020) on urban flood risk mapping and Insani et al. (2022) on dynamic evacuation planning, my work translates scientific models into actionable city-level insights.
The analysis combined predictive modeling with geospatial data to create a composite flood risk map — one that blends physical hazard with human vulnerability.
Rising Risks in an Urban Landscape : Flood Risk in NYC
Flood risk in NYC is a complex interplay of natural hazards — such as elevation, rainfall, and slope — and urban vulnerability, which includes infrastructure quality, emergency services, and population demographics.
Traditional flood maps often miss this multi-layered reality, making evacuation and resource allocation less effective.
Understanding Flood Risk
Risk = Hazard × Vulnerability
Hazard – The probability and severity of a flood, shaped by factors like elevation, slope, rainfall, and proximity to water.
Vulnerability – The exposure and sensitivity of people, infrastructure, and services to that hazard.
Why This Matters
By combining these two dimensions, we move beyond simply asking:
“Where might the water go?”
…to answering:
“Who and what will be affected, and how badly?”
How I Built the Model
The methodology drew on raster and vector geospatial datasets, predictive modeling, and statistical weighting techniques: The project followed a risk = hazard × vulnerability framework (Eini et al., 2020), adapted to NYC’s unique data environment.
Step 1 – Gathering the Data
- Elevation: 1-foot Digital Elevation Model (DEM) from NYC Open Data (2013).
- Rainfall: NASA Giovanni (2015–2020) five-year historical precipitation data.
- Slope: Derived from DEM to identify low-gradient areas prone to water accumulation.
- Hydrology: Proximity to shoreline and water bodies from the NYC Planimetric Database.
- Infrastructure: Roads, bridges, hospitals, schools, residential and commercial buildings from NYC Planning Zola.
- Population: Demographic data from NYC Population FactFinder and US Census.
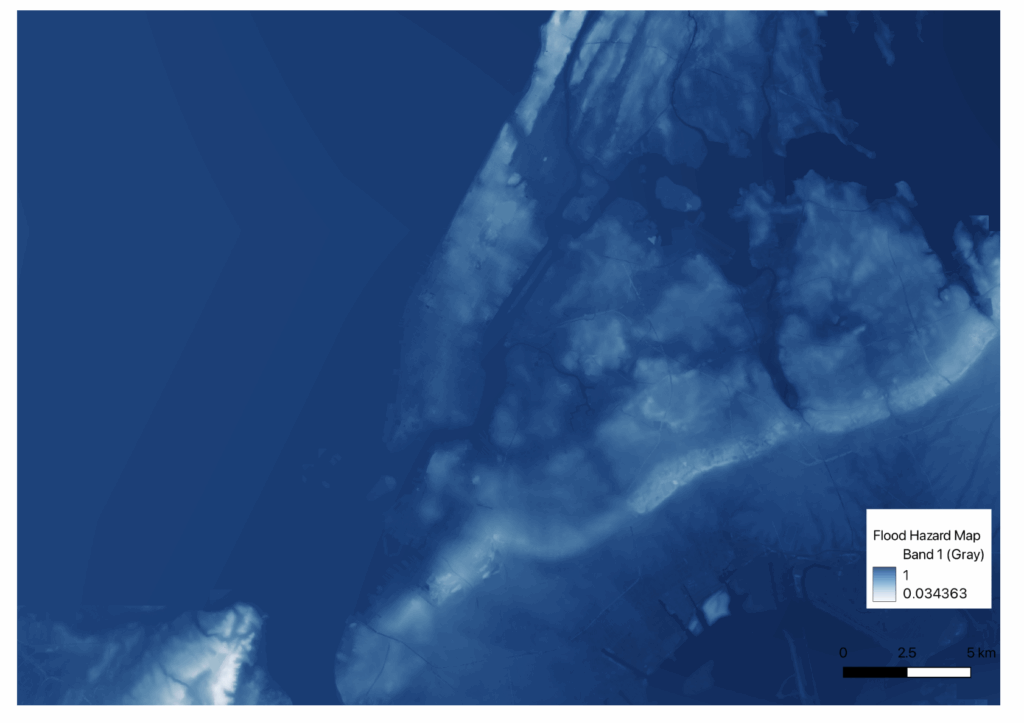
Step 2 – Mapping Flood Hazard
To map flood hazard, I used the Genetic Algorithm for Rule-set Prediction (GARP) — an evolutionary model that tests and selects the best predictive rules based on environmental inputs. This evolutionary algorithm iteratively selects the best rule sets for flood prediction, as demonstrated in Avand et al. (2021).
Model evaluation was limited by the lack of historical flood extent data — a key recommendation for future work.

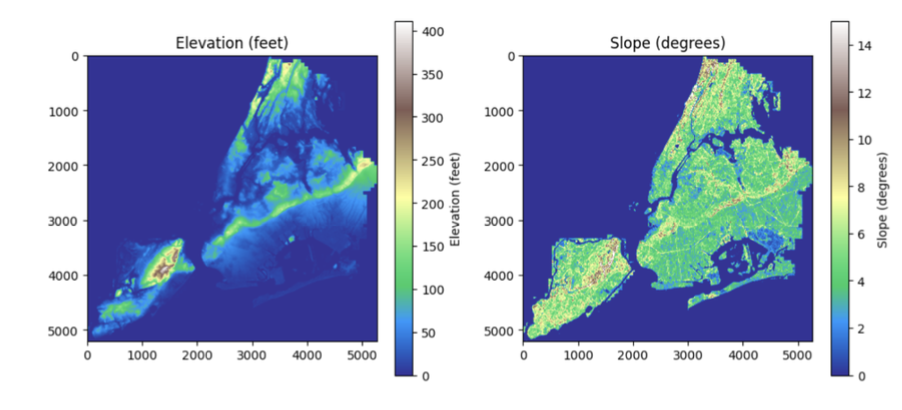

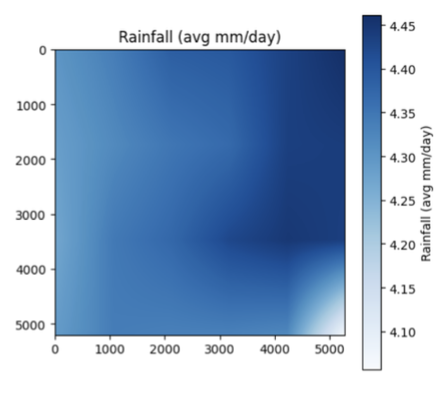
- Inputs: Elevation, slope, and rainfall
- Output: A flood hazard probability map
While historical flood data wasn’t available for model validation, GARP offers a strong baseline for hazard prediction that can be refined with real-world event data.

Step 3 – Assessing Vulnerability
Flood hazard alone isn’t enough. Vulnerability depends on infrastructure, proximity to water, emergency service availability and socio-economic conditions of the demography.
I built four vulnerability indices:
- Infrastructure Vulnerability – building density, structural quality, commercial/residential ratio
- Water Vulnerability – proximity to shoreline and FEMA flood zones
- Emergency Vulnerability – density of fire and police stations
- Social Vulnerability – vulnerability index based on population demographic, and socio economic groups.
Each sub-index was normalized between 0–1 and weighted using Analytical Hierarchical Process (AHP) and Principal Component Analysis (PCA).
- Sub-indices for infrastructure, water exposure, and emergency services were created.
- Weighting applied via Analytical Hierarchical Process (AHP) and Principal Component Analysis (PCA) to prioritize factors based on relevance.
- Normalization scaled each sub-index to a 0–1 range for comparability.
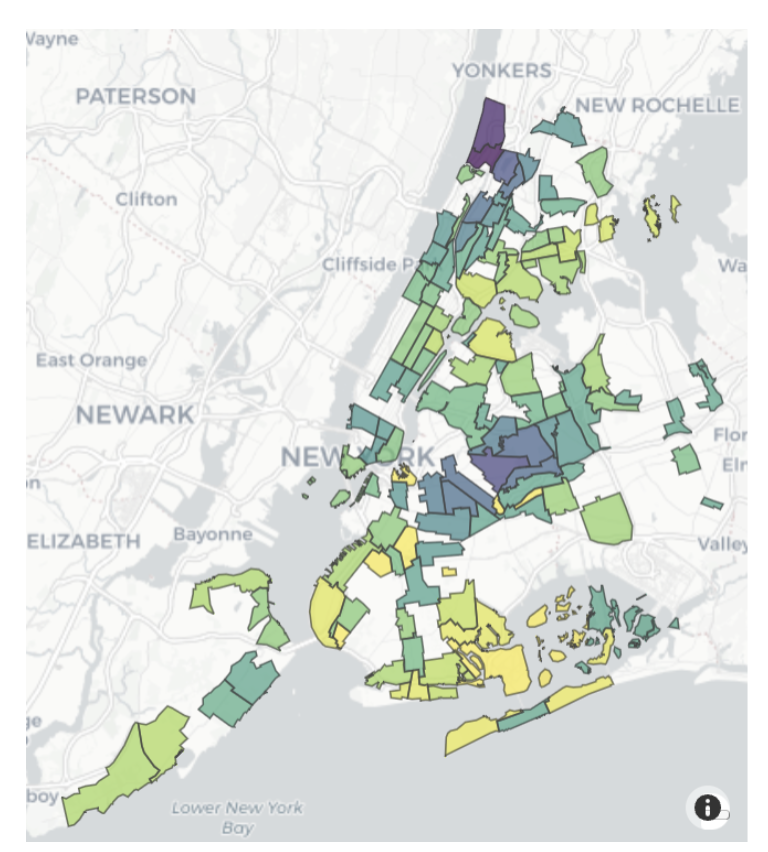
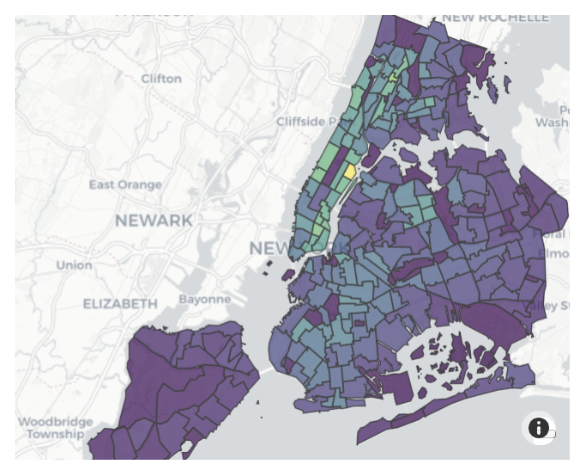
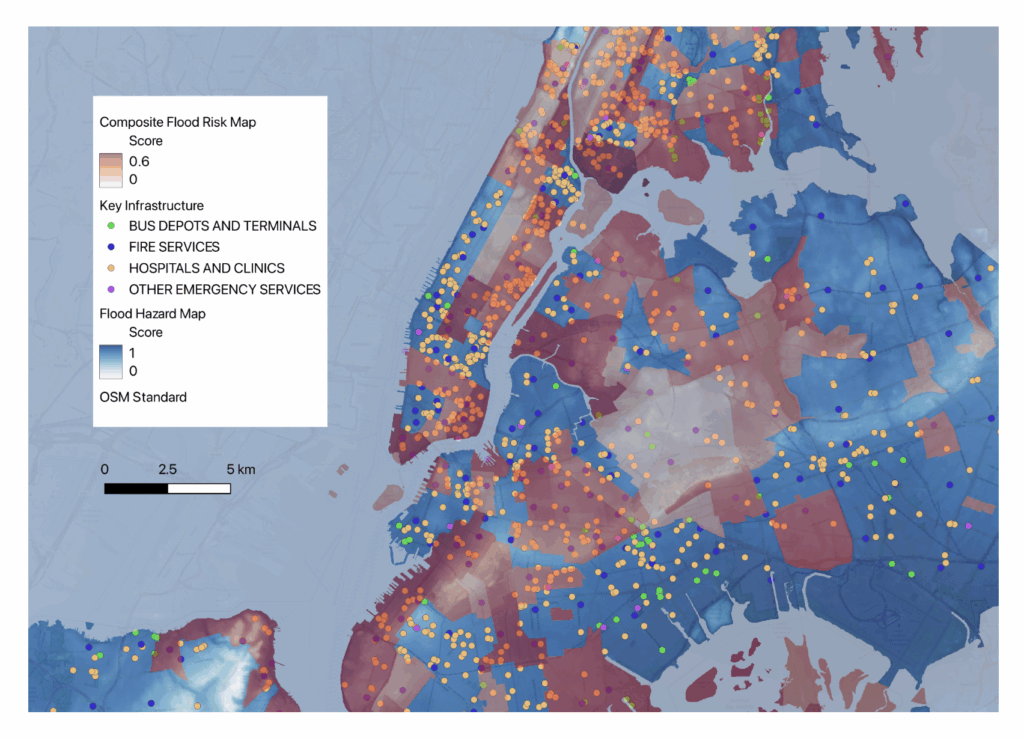
the above plot shows water hazard and population vulnerability.
Step 4 – Merging Hazard and Vulnerability
The final step was to combine hazard and vulnerability maps through a weighted linear combination.
Hazard (raster) and vulnerability (converted to raster) layers were merged to produce a composite flood risk map at the NTA level. Results were visualized at the Neighborhood Tabulation Area (NTA) level. Hazard and vulnerability layers were combined using weighted linear combination.

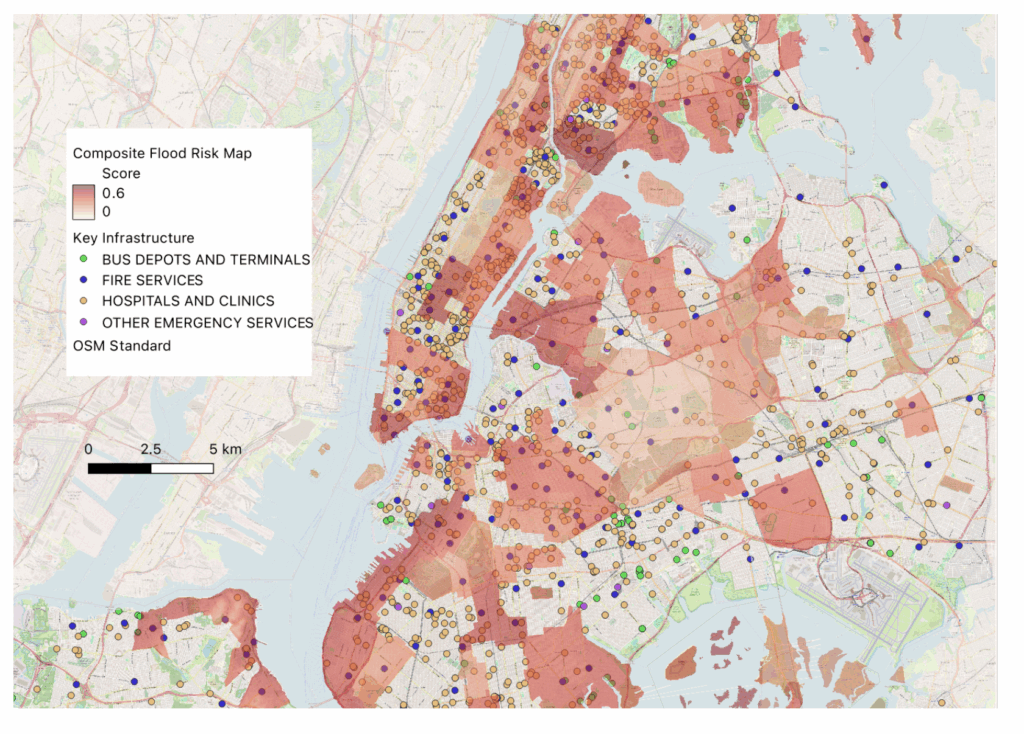
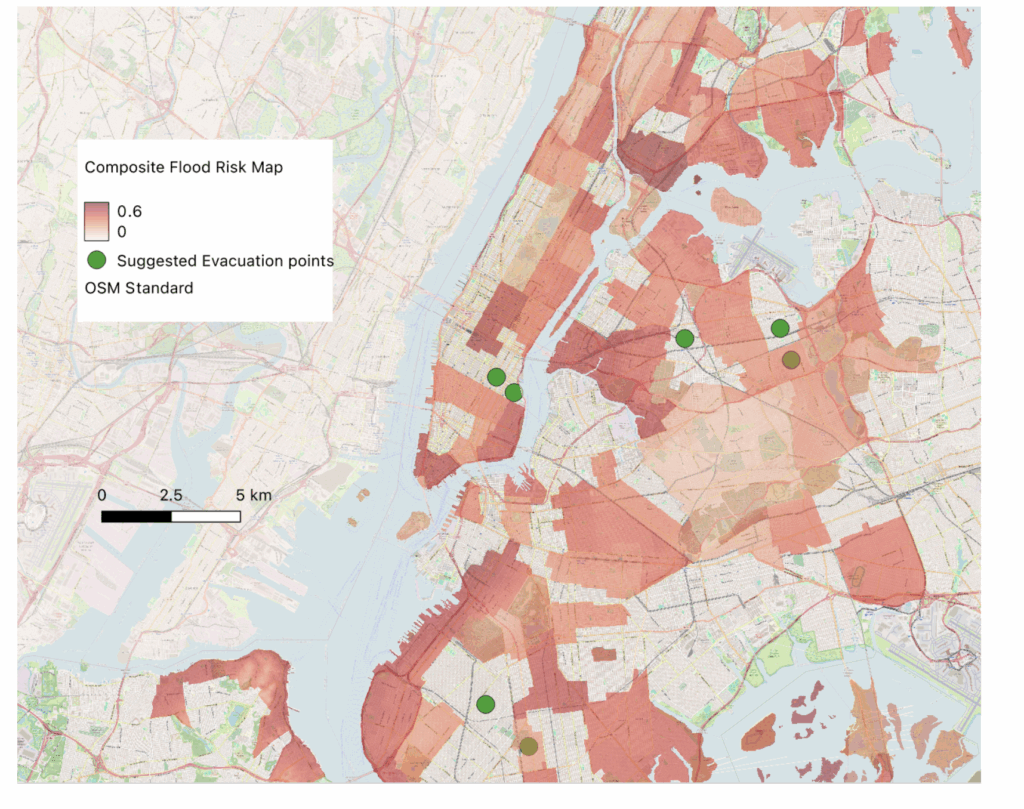
What I discovered
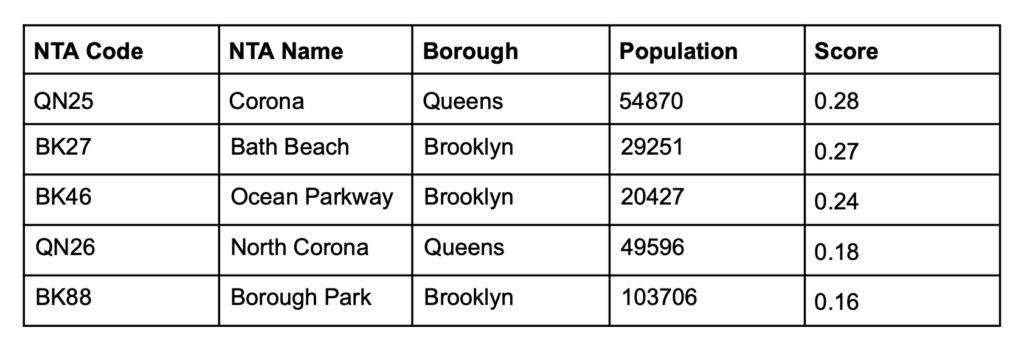
The analysis revealed that the highest-risk zones are concentrated in coastal neighborhoods across Brooklyn, Queens, and Lower Manhattan, where both hazard levels and vulnerability factors converge. Interestingly, some inland areas also ranked high, not because of their physical exposure, but due to poor infrastructure quality, which increases their susceptibility to damage even during smaller flood events. In addition, areas with sparse emergency service coverage could experience delayed responses, amplifying the impact of flooding even in cases where the hazard itself is moderate.

From Maps to Action
These results provide city planners with a clear foundation for targeted flood preparedness. Evacuation routes can be optimized using travel-time-weighted shortest-path algorithms (Jin, n.d.), ensuring that residents can reach safety as quickly as possible even under traffic constraints. Shelters, medical units, and other critical resources should be strategically located outside high-risk zones to remain operational during flood events. The analysis also highlights underserved areas where emergency services are limited, allowing planners to address these gaps before a crisis occurs. Equally important is maintaining transparency in these decisions so that communities understand the reasoning behind evacuation priorities and resource placement.

Why It Matters
This isn’t just about predicting floods — it’s about reducing human and economic loss.
By integrating hazard modeling with vulnerability assessment, we get a more complete picture of flood risk. This helps:
- Target resources where they’re needed most
- Design fair and efficient evacuation plans
- Plan infrastructure upgrades for climate resilience
While this analysis provides a strong foundation for understanding flood risk in New York City, several enhancements could improve both accuracy and applicability. Incorporating historical flood event data would allow for direct validation of the GARP-based hazard model, ensuring its predictive accuracy against observed impacts. Integrating climate projections for 2050 and 2100 would enable forward-looking risk assessments, accounting for sea level rise, changes in precipitation patterns, and evolving urban landscapes. Finally, expanding the social vulnerability dataset to include complete demographic coverage across all NTAs would create a more comprehensive model, ensuring that populations most at risk—due to age, income, or language barriers—are fully represented in preparedness planning.
This work builds upon methodologies from Eini et al. (2020) for hazard–vulnerability integration, as well as evacuation optimization strategies discussed by Jin (n.d.) and Insani et al. (2022). The combination of predictive modeling, geospatial analysis, and socio-economic evaluation reflects a multidisciplinary approach to climate risk assessment that is increasingly vital for urban resilience planning.

Skills and Tools Applied
The project leveraged a broad set of technical and analytical skills, including:
- Geospatial Analysis – QGIS, Rasterio, GeoPandas
- Predictive Modeling – Genetic Algorithm for Rule-set Prediction (GARP)
- Statistical Weighting – Analytical Hierarchical Process (AHP), Principal Component Analysis (PCA)
- Data Science – Python (Pandas, NumPy, Matplotlib)
- Urban Risk Planning – Evacuation route optimization, infrastructure vulnerability assessment
For the full methodology, datasets, and reproducible analysis code, visit my GitHub repository here: https://github.com/tarunluthra/floodrisk-hazard-modeling
References
1 foot Digital Elevation Model (DEM). (2013, August 9). NYC Open Data. https://data.cityofnewyork.us/City-Government/1-foot-Digital-Elevation-Model-DEM-/dpc8-z3jc/about
Avand, M., Moradi, H., & Iasboyee, M. R. (2021). Using machine learning models, remote sensing, and GIS to investigate the effects of changing climates and land uses on flood probability. Journal of Hydrology, 595, 125663. https://doi.org/10.1016/j.jhydrol.2020.125663
BYTES of the BIG APPLE – DCP. (n.d.). NYC Department of City Planning. Retrieved June 17, 2024, from https://www.nyc.gov/site/planning/data-maps/open-data.page#digitalcitymap
Census. (n.d.). Download and Metadata. Retrieved June 17, 2024, from https://www.nyc.gov/site/planning/data-maps/open-data/census-download-metadata.page
Chakrabortty, R., Pal, S. C., Janizadeh, S., Santosh, M., Roy, P., Chowdhuri, I., & Saha, A. (2021). Impact of climate change on future flood susceptibility: An evaluation based on deep learning algorithms and GCM model. Water Resources Management, 35(12), 4251–4274. https://doi.org/10.1007/s11269-021-02944-x
CoreData.nyc. (n.d.). NYU Furman Center. Retrieved June 17, 2024, from https://app.coredata.nyc
Eini, M., Kaboli, H. S., Rashidian, M., & Hedayat, H. (2020). Hazard and vulnerability in urban flood risk mapping: Machine learning techniques and considering the role of urban districts. International Journal of Disaster Risk Reduction, 50, 101687. https://doi.org/10.1016/j.ijdrr.2020.101687
Giovanni. (n.d.). NASA Global Precipitation Measurement Mission. Retrieved June 17, 2024, from https://gpm.nasa.gov/data/sources/giovanni
Insani, N., Akman, D., Taheri, S., & Hearne, J. (2022). Short-notice flood evacuation plan under dynamic demand in high populated areas. International Journal of Disaster Risk Reduction, 74, 102844. https://doi.org/10.1016/j.ijdrr.2022.102844
Janizadeh, S., Chandra Pal, S., Saha, A., Chowdhuri, I., Ahmadi, K., Mirzaei, S., Mosavi, A. H., & Tiefenbacher, J. P. (2021). Mapping the spatial and temporal variability of flood hazard affected by climate and land-use changes in the future. Journal of Environmental Management, 298, 113551. https://doi.org/10.1016/j.jenvman.2021.113551
NYC planimetric database: Shoreline. (n.d.). NYC Open Data. Retrieved June 17, 2024, from https://data.cityofnewyork.us/Recreation/NYC-Planimetric-Database-Shoreline/2qj2-cctx
NYC planning population factfinder. (n.d.). Retrieved June 17, 2024, from https://popfactfinder.planning.nyc.gov
NYC planning zola. (n.d.). NYC’s Zoning & Land Use Map. Retrieved June 17, 2024, from https://zola.planning.nyc.gov
NYC street map. (n.d.). https://streets.planning.nyc.gov/data